library(tidyverse)
library(scales)Ex 1.2: Fisheries of the world
Introduction
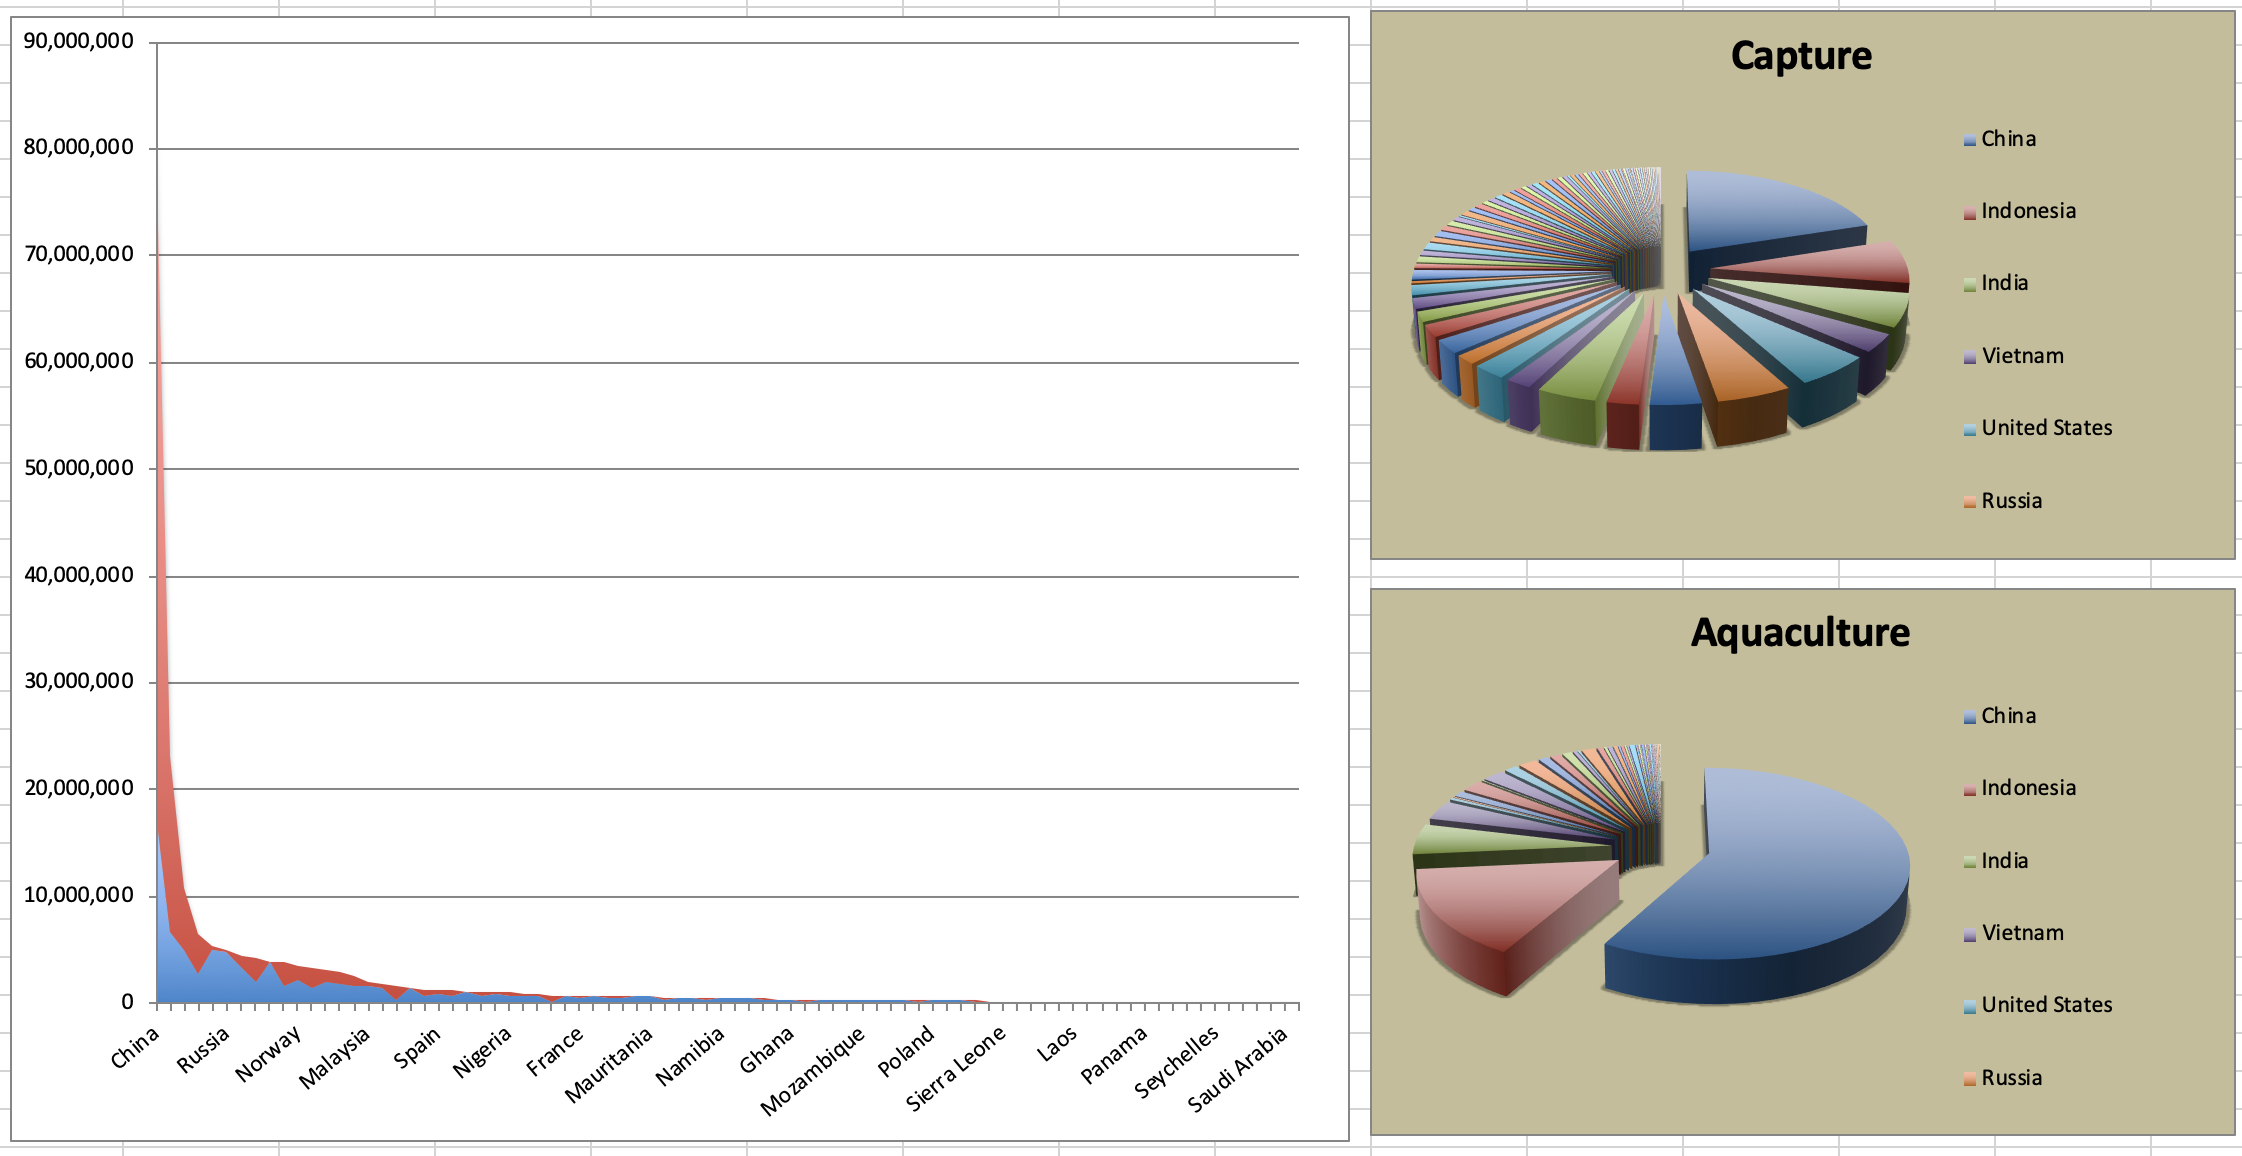
Fisheries and Aquaculture Department of the Food and Agriculture Organization of the United Nations collects data on fisheries production of countries. The (not-so-great) visualization below shows the distribution of fishery harvest of countries for 2016, by capture and aquaculture.

- Countries whose total harvest was less than 100,000 tons are not included in the visualization.
- Source: Fishing industry by country
Exercise 1
What are some ways you would improve the visualization above?
Add your response here.
Packages
We will use the tidyverse and scales packages for data wrangling and visualization.
Data
Let’s load the data:
fisheries <- read_csv("data/fisheries.csv")Rows: 216 Columns: 4
── Column specification ────────────────────────────────────────────────────────
Delimiter: ","
chr (1): country
dbl (3): capture, aquaculture, total
ℹ Use `spec()` to retrieve the full column specification for this data.
ℹ Specify the column types or set `show_col_types = FALSE` to quiet this message.And inspect it:
glimpse(fisheries)Rows: 216
Columns: 4
$ country <chr> "Afghanistan", "Albania", "Algeria", "American Samoa", "An…
$ capture <dbl> 1000, 7886, 95000, 3047, 0, 486490, 3000, 755226, 3758, 14…
$ aquaculture <dbl> 1200, 950, 1361, 20, 0, 655, 10, 3673, 16381, 0, 96847, 34…
$ total <dbl> 2200, 8836, 96361, 3067, 0, 487145, 3010, 758899, 20139, 1…Data prep
Filter out countries whose total harvest was less than 100,000 tons since they are not included in the visualization:
fisheries <- fisheries |>
  filter(total > 100000)
Then, we will join this with the continent data.
continents <- read_csv("data/continents.csv")Rows: 245 Columns: 2
── Column specification ────────────────────────────────────────────────────────
Delimiter: ","
chr (2): country, continent
ℹ Use `spec()` to retrieve the full column specification for this data.
ℹ Specify the column types or set `show_col_types = FALSE` to quiet this message.Data joins
Exercise 2
We want to keep all rows and columns from fisheries and add a column for corresponding continents. Which join function should we use? Explain your reasoning.
Add your response here.
Exercise 3
Join the two data frames with fisheries <- *_join(fisheries, continents) using the join function you decided on in the previous question. How does this function know to join the two data frames by country?
Hint: Take a look at the variables in the two datasets you’re joining.
Add response here.
# add code hereExercise 4
Do all countries in fisheries have a continent assigned? If not, which countries are missing continents (NAs)?
Add your response here
# add code hereExercise 5
Fill in the missing continents for these countries and justify your decisions. Then check to make sure all countries now have continents assigned.
# add code hereExercise 6
Calculate the percentage of aquaculture harvest for each country, record these values in a new variable called aquaculture_perc.
# add code hereExercise 7
Calculate minimum, mean, and maximum aquaculture percentage for each continent and visualize these values as a bar plot.
# add code here